
Fig. 2.
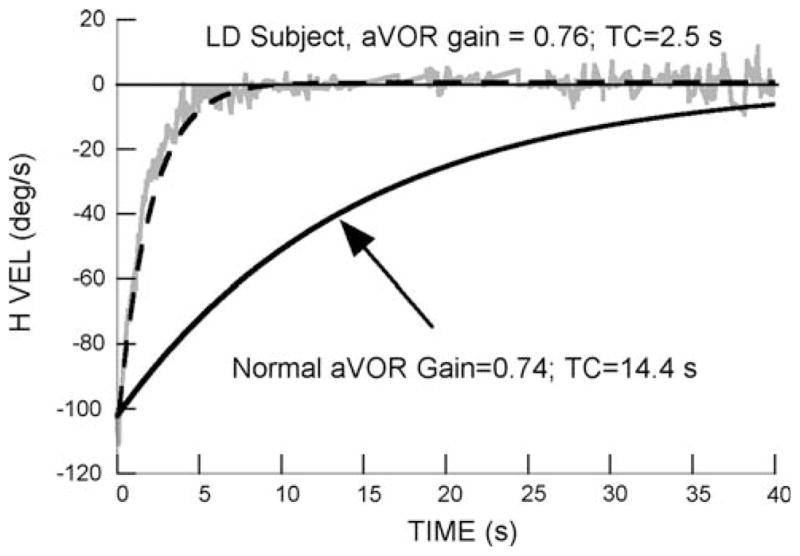
Comparison of the per-rotatory response of a labyrinthine-defective subject (S1) with the average responses to rotation of 16 normal subjects (Dai et al. 2003). All subjects were rotated at 138°/s. The desaccaded slow phase eye velocity (H VEL) of the labyrinthine-defective subject is shown by the gray trace, and is fit by a first order exponential function (dashed line). The averaged normal aVOR responses are shown by the black line (upward arrow)