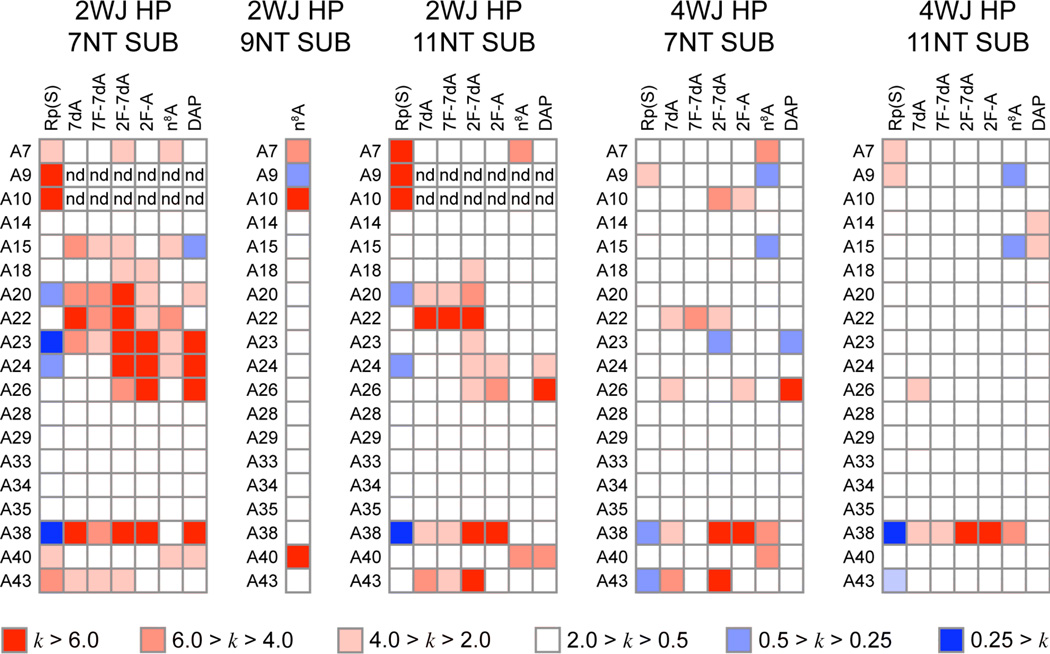
Figure 4.
Average interference values as a function of analog (columns) and nucleotide position (rows) for the construct/substrate pairs indicated. The first column of each matrix provides the phosphorothioate effect, which is controlled for in calculating other interference values. Interference values are color coded as indicated from strong interference (deep red) to strong enhancements (deep blue). Sites where large phosphorothioate effects prevented the calculation of interference values are marked "nd". The single column for the n8A analog in a 2WJ construct 9NT substrate selection is data taken from our previous study(21).

