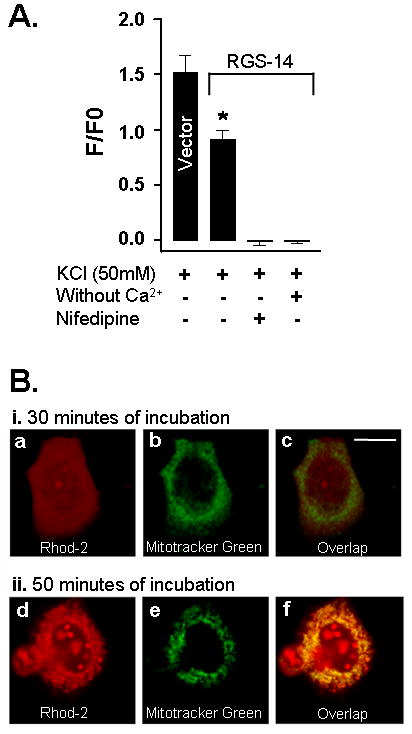
Fig. 2.

Presence of RGS-14 protein reduces cytoplasmic Ca2+ level in NG108-15 cells loaded with Rhod-2 dye via Cav1 channels. A, Similar to SH-SY5Y cells in Fig. 1, control vector (vector) transfected NG108-15 cells in combination with Rhod-2 dye produced an increase in cytoplasmic Ca2+ concentration when exposed to 50 mM KCl. Expression of RGS-14 protein led to a substantial reduction in the Ca2+ level. Both the absence of Ca2+ in medium and presence of nifedipine completely abolished the cytoplasmic Ca2+ level. B, Incubation for 30 min with Rhod-2 dye showed no dye presence in mitochondria of NG108-15 cells. i, shows the presence of fluorescence after co-incubation with Rhod-2 (a) and Mito-Tracker Green (b), a dye specific for mitochondria, for 30 min. Merged images in (c) demonstrates no co-localization of Mito-Tracker Green with Rhod-2 and no presence of Rhod-2 dye in mitochondria. ii, fluorescence level observed after co-incubation with Rhod-2 (d) and Mito-Tracker Green (e) for 50 min. Merged images of Mito-Tracker Green with Rhod-2 show co-localization of both dyes in mitochondria (f). Scale bar is 75 μm. *, indicates significantly different from control vector.
