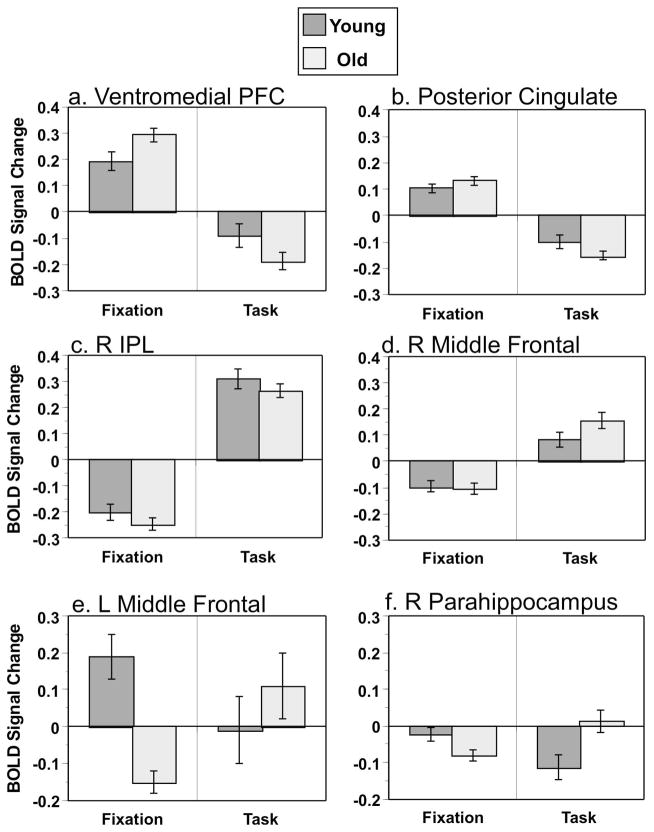
Figure 3.
BOLD signal changes in six regions, as examples from LV1 and LV2 (values are mean centered, see Table 2 for coordinates). a: ventromedial prefrontal cortex (DMN region, LV1); b: posterior cingulate (DMN region, LV1); c: right inferior parietal lobe (TPN region, LV1). d: right middle frontal gyrus (TPN region, LV1); e: left middle frontal gyrus (TPN region, LV2); f: right parahippocampal gyrus (DMN region, LV2). Error bars represent the standard error of the mean.

