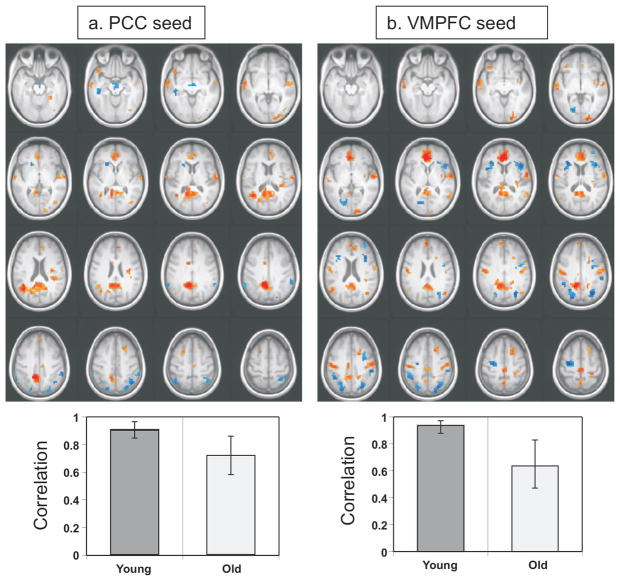
Figure 5.
Functional connectivity of the DMN in younger and older adults during fixation using a seed in the posterior cingulate (PCC, panel a) and one in ventromedial prefrontal cortex (VMPFC, panel b). In the top part of each panel is shown the regions where activity was either positively (red regions) or negatively (blue regions) correlated with the seeds. In the bottom part of each panel is shown the correlation between seed activity and the brain scores from the seed PLS. For both seeds, there is positive connectivity between the seed and other DMN regions, and negative correlations with the seeds are seen in TPN regions. A bootstrap ratio threshold of 3.0 was used for both brain images. The error bars on the correlations represent the 95% confidence intervals (determined via the bootstrap).

