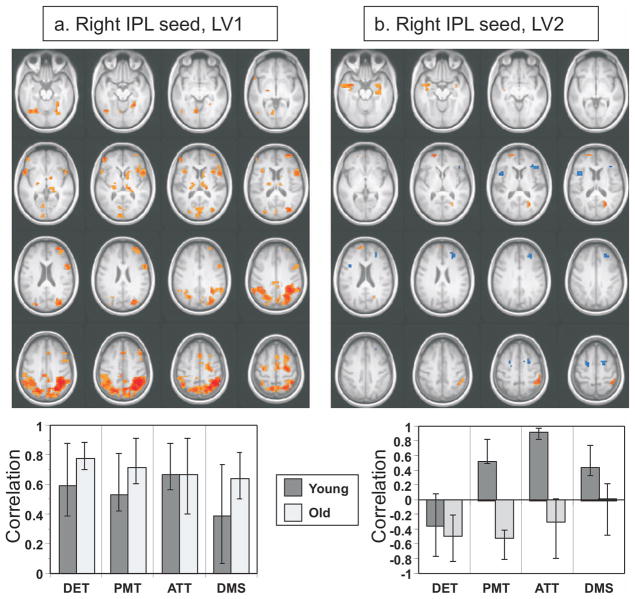
Figure 6.
Functional connectivity of the TPN in younger and older adults across all four tasks using a seed in the right inferior parietal lobe (IPL). a: The regions where activity was positively correlated with the seed in both age groups are shown in the top (there were no reliable negative correlations). In the bottom part of panel a is shown the correlation between seed activity and the brain scores from LV1 across the four tasks. b: The top part of the panel shows regions where activity was positively correlated with the seed in young adults (red areas) and a different set of regions that was positively correlated with the seed in older adults (blue regions). In the bottom part of panel b is shown the correlation between seed activity and the brain scores from LV2 across the four tasks. A bootstrap ratio threshold of 3.0 was used for both brain images. The error bars represent the 95% confidence intervals (determined via the bootstrap).

