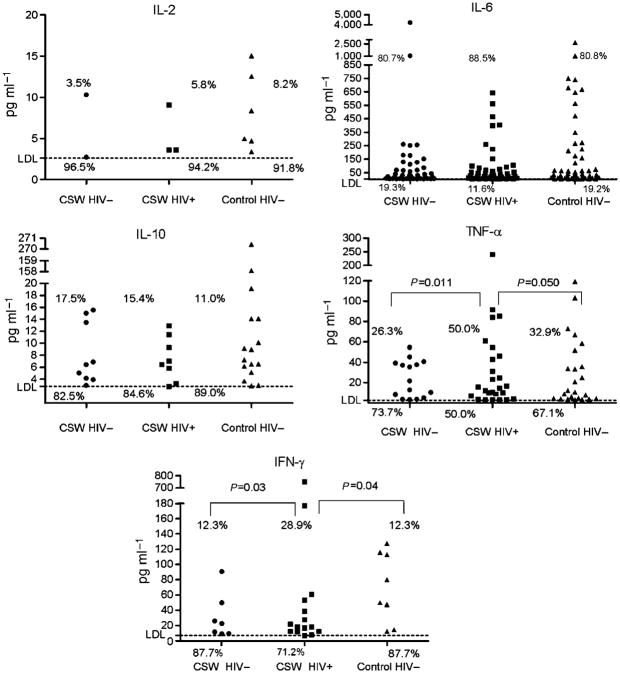
Figure 1.
Distribution of IL-2, IL-6, IL-10, TNF-α, and IFN-γ CVL levels according to the study groups. CVL cytokine levels were quantified by BD Cytometric Bead Array and normalized to a standard curve. The LDL for each assay was 2.6 pg ml− for IL-2, 3.0 pg ml−1 for IL-6, 2.8 pg ml−1 for IL-10 and TNF-α, and 7.1 pg ml−1 for IFN-γ. Sample measurements below the LDL were assigned a value of 0. Values are expressed in pg ml−1. Owing to the high number of samples below the assay LDL, cytokine levels were dichotomized as detectable and undetectable in all analyses. Comparisons of the cytokine detection rates (% of women producing cytokine levels above the LDL) between two study groups were examined with the χ2 test. Significant (or near significant) differences in the cytokine detection rates between the two groups are shown. Differences that were not statistically significant are not illustrated. CVL, cervicovaginal lavage; IFN, interferon; IL, interleukin; LDL, lower detection limit; TNF, tumor necrosis factor.

