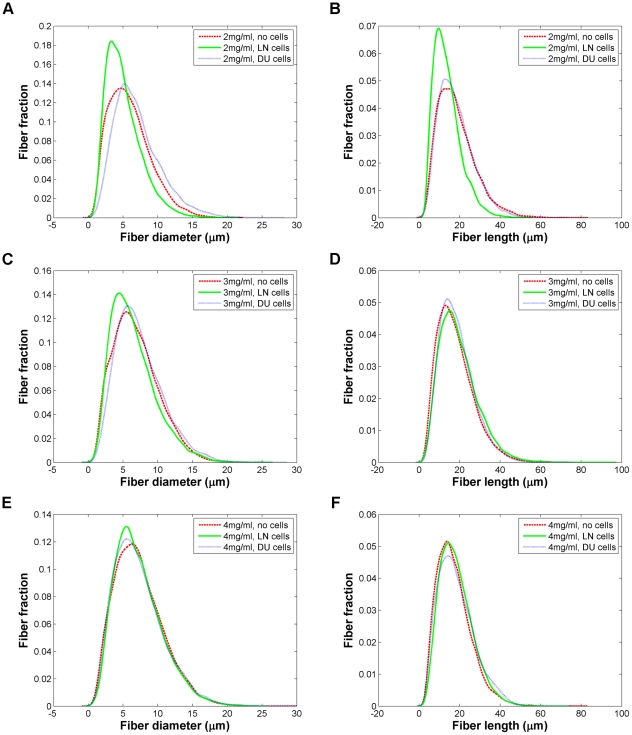
Figure 4. Comparison of fiber profiles for gels seeded without cells, with LNCaP cells, and with DU-145 cells.
Fiber diameters for (A) 2 mg/ml; (C) 3 mg/ml; and (E) 4 mg/ml. Fiber lengths for (B) 2 mg/ml; (D) 3 mg/ml; and (F) 4 mg/ml. The y-axis indicates the decimal fraction of fibers with a given diameter or length, as is the case in the other fiber profile graphs (see also Figure S1C–F).

