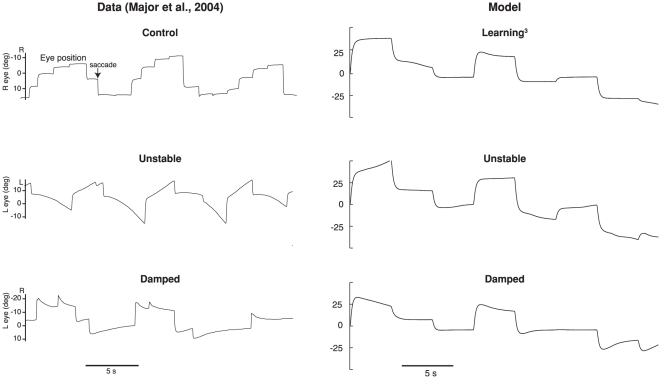
Figure 8. A comparison of the simulated detuning experiments with experimental data [30].
The top trace is for the control situation, which for the model is tuning after a 30% perturbation and 5% continuous noise. The middle trace shows the unstable integrator, and the bottom trace shows the damped integrator. The goldfish traces are from animals that had longer training times (6 h and 16.5 h respectively), than the model (20 min). Both the model and experiment demonstrate increased detuning with longer training times (not shown), and both show the expected detuning (drift away from midline for the unstable case, and drift towards midline in the damped case).

