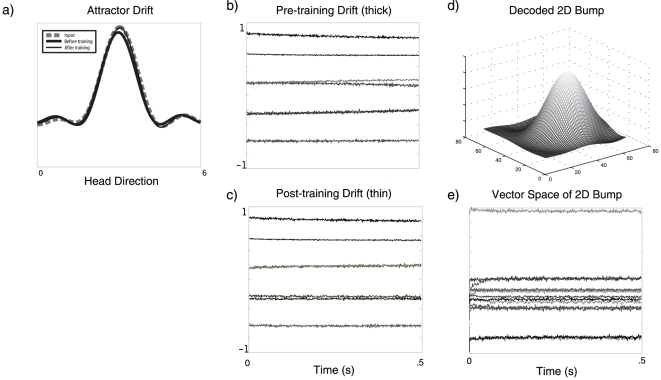
Figure 12. Simulations of tuning attractor networks in higher dimensional spaces.
a) The input (dashed line) along with the final position of the representation after 500 ms of drift for pre-training (thick line) and post-training (thin line). b) The pre-training drift in the vector space over 500 ms at the beginning of the simulation for the bump (thick line in a). d) The drift in the vector space over 500 ms after 1200 s of training in the simulation (thin line in a). Comparing similar vector dimensions between b) and c) demonstrates a slowing of the drift. d) A 2D bump in the function space for the simulated time shown in e), after training. e) The vector drift in the 14-dimensional space over 500 ms after training.

