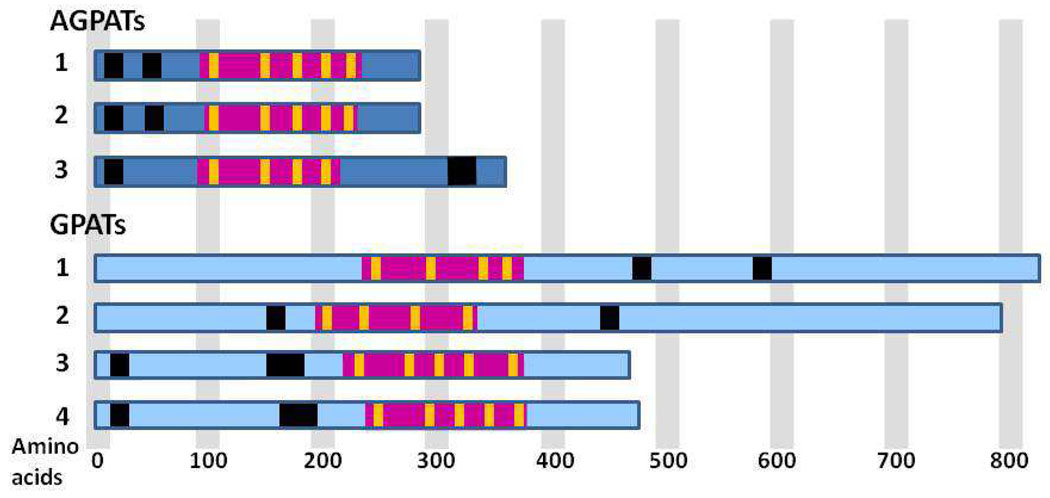
Figure 3. Predicted structures of confirmed mammalian AGPAT and GPAT isoforms.
Black regions represent predicted transmembrane domains (PredictProtein; TMHMM; TMpred). Additional transmembrane domains are predicted, but are not shown because they would place sections of the active site region on opposite membrane sides. These predicted domains could interact closely with the membrane. The large rose regions represent the active site region intersected by yellow stripes to indicate the 4 or 5 conserved motifs. Only the topography of GPAT1 has been confirmed experimentally.28 All active site regions face the cytosol.27

