Figure 6.
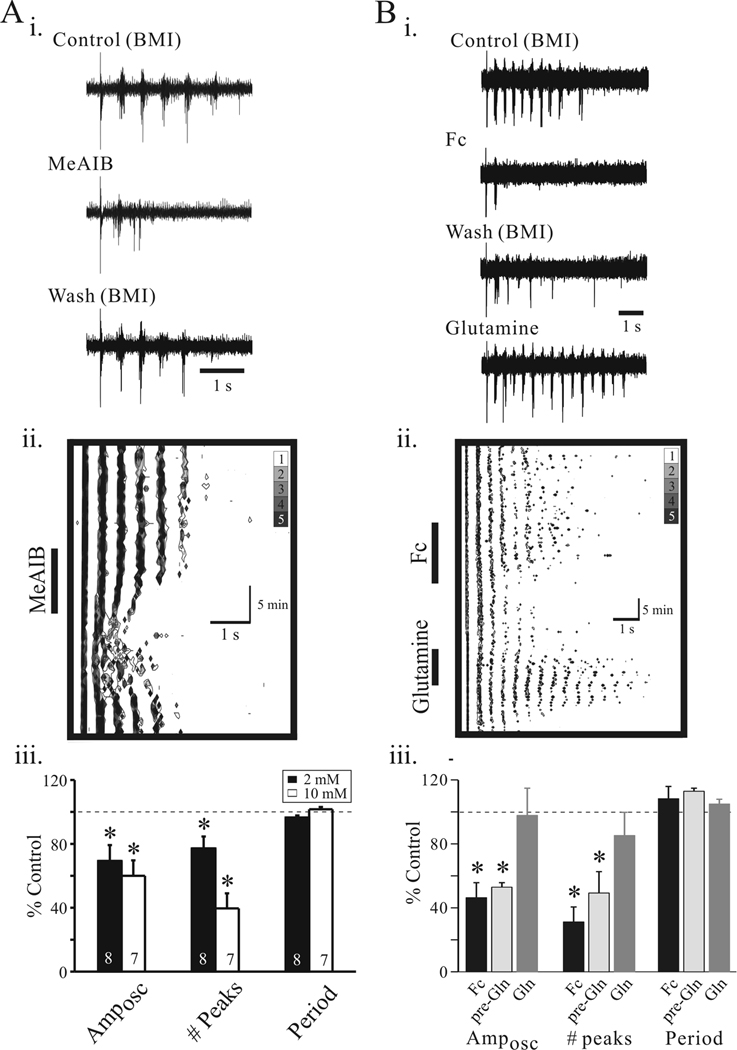
Disrupting glial function attenuates intrathalamic oscillations. Ai. Representative traces of extracellular recording from VB illustrating slow intrathalamic oscillation in Control (10µM BMI, a), following MeAIB (10 mM, 5 min) application (b), and 15 min wash (c). Aii. Contour plot of experiment in Ai. The abscissa corresponds to a single oscillatory in response to TRN stimulation. The time course of the overall experiment is represented by the ordinate starting with time equal to zero at the top. Aiii. Population data indicate significant suppression of Amposc and # peak, but no change in period at two different concentrations of MeAIB (2 and 10 mM). B: Fc attenuates intrathalamic oscillations. Bi. Representative traces of extracellular recordings in Control (10µM BMI, a), following Fc (50 µM, 15 min) application (b), 15 min wash (c), and glutamine application (Gln; d). Bii. Contour plot of experiments in Bi illustrate the anti-oscillatory actions of Fc and subsequent reversal by glutamine. Biii. Population data calculated from the autocorrelograms indicate anti-oscillatory actions of Fc on Amposc and # peak. Error bars represent SD. *, p<0.05.

