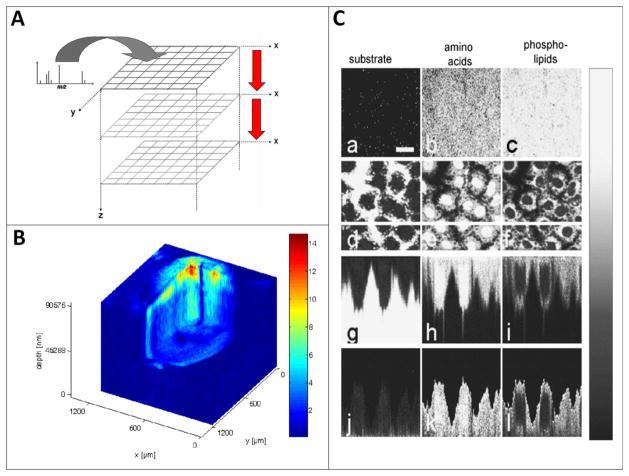
Figure 2.
1st examples of 3D biological imaging using ToF-SIMS. A. A stack of images is acquired using interleaved analyse/etch cycles. B shows the distribution of a triacylglyceride species over the mass range m/z 815 960 imaged during the erosion of approximately 100 μm of material from a Xenopus laevis oocyte using C60+.
Using a liquid metal ion beam for analysis combined with C60+ for etching sub-cellular 3D structure can be observed in panel C where mass-resolved secondary ion images of the surface of normal rat kidney cells before any sputter cycle had been applied (a–c) and within the cell after the 45th sputter cycle (d–f) images are based on the following secondary ions: (a), (d), (g) and (j): Na+; (b), (e), (h) and (k): amino acid fragment ions (pooled signal for m/z 30, 44, 70, 101, 110, 136); (c), (f), (i) and (l): phospholipid fragment ions (pooled signal for m/z 58, 166, 184, 760). (g), (h) and (i) are cross-sectional images in the plane of the white horizontal marker line in (d), (e) and (f) while (j), (k) and (l) are the same data but with the interface with the silicon wafer substrate set to be flat and truncated at that interface in order to display the cells with a more realistic shape. The scale bar in (a) corresponds to 20 μm. Adapted with permission from references 23 and 24.

