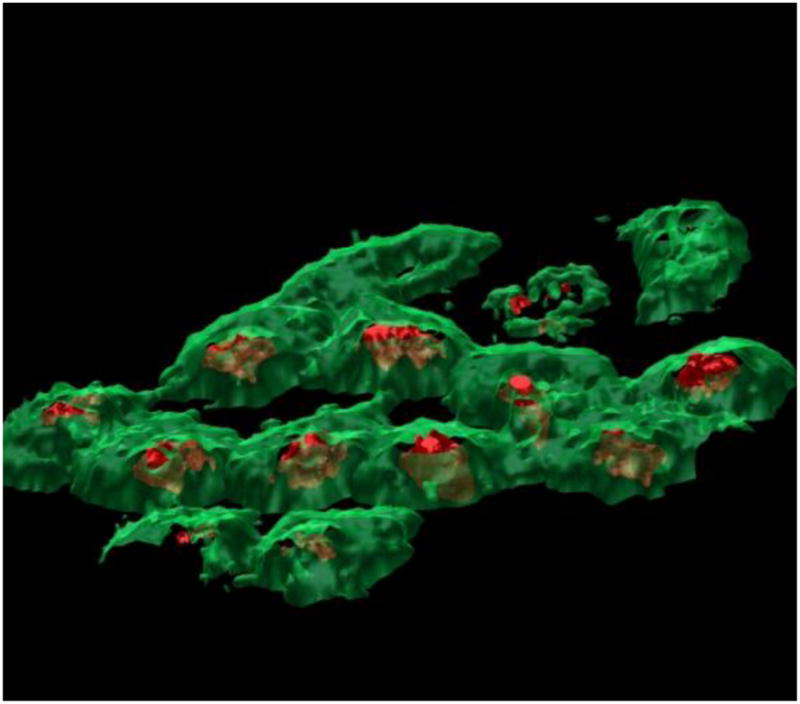
Figure 4.

3D visualisation of the membrane (green, m/z 184.1, phosphocholine) and nucleus (red, m/z 136.1, adenine) chemistry in the frozen hydrated HeLa-M cells following the use of PCA to identify the interface between the cells and the substrate to allow more representative data reconstruction. The visualised area is 250 × 250 μm2, but inclined in order to aid 3D visualisation. Reproduced with permission from reference 33.
