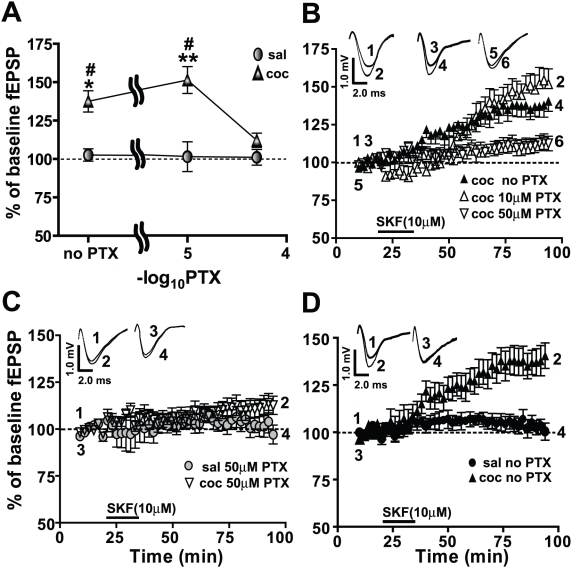
Figure 3. GABAergic inhibition in the BLA-lcCeA synapse is essential for SKF81297-induced LTP in the cocaine CPP group.
Field EPSP magnitude is plotted with respect to baseline values as a function of increasing PTX concentrations. Responses are plotted as percent change from the baseline fEPSPs as a function of time. Numbers on the representative traces show the time on the graph at which they were recorded. A) In the cocaine CPP group (filled triangles), SKF81297-induced LTP is lost when GABAergic inhibition is blocked with 50 µM PTX (saline: 101.1±5.1%, cocaine: 112.2±4.6%, ns, n = 7). In the saline-treated groups (filled circles: 102.6±4.0%, 101.6±9.7% and 101.1±5.1%, ns, n = 5–7), the SKF81297-associated fEPSPs do not show a dependence on the extent of GABAergic inhibition. B) SKF81297-induced LTP at different concentrations of PTX in amygdala slices from the cocaine CPP group is plotted as a function of time. LTP in 50 µM PTX (inverted triangles, 112.2±4.6%, n = 7) is inhibited compared to LTP in 10 µM PTX (clear triangles, 151.4±8.8%, n = 6) or LTP in no PTX (filled triangles, 137.5±6.9%, n = 5). C) SKF81297-induced LTP in 50 µM PTX (inverted clear triangles) in the cocaine CPP group is diminished to levels recorded in the saline-treated group (filled circles). D) With GABAergic inhibition intact, SKF81297-induced LTP is significantly increased in the cocaine CPP group (filled triangles) compared to the saline-treated group (filled circles). Panels use same data graphs as in A, B and fEPSP traces in B to illustrate the comparisons. For comparison, all panels use same data graphs and fEPSP traces for the slices from cocaine CPP group superfused with SKF81297 in 10 µM PTX represented in Figures 1 and 2.

