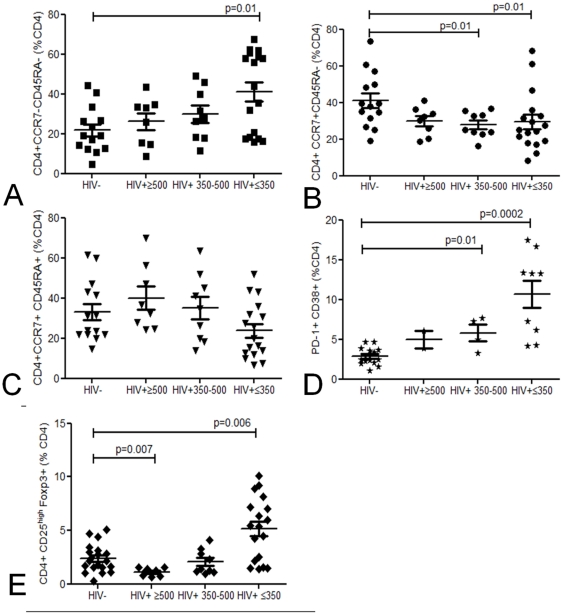
Figure 1. Baseline phenotyping of peripheral blood CD4 T cells.
Proportional representation of circulating TEM (CD4+CCR7−CD45RA−) (a), TCM (CD4+CCR7+CD45RA−) (b), naïve T cells (CD4+CCR7+CD45RA+) (c), regulatory (CD4+CD25highFoxp3+) (d) and senescent (CD4+CD38+PD-1+) (e) CD4 T cells using flow cytometry in healthy controls (n = 8–14) and HIV-infected groups (≥500 (n = 2–10) 350−500 (n = 4-9) ≤350 (n = 17–19) CD4 T cells/µl blood). Black horizontal bars represent median values of CD4 subsets. Statistical significance was analyzed by the Mann Whitney U test.

