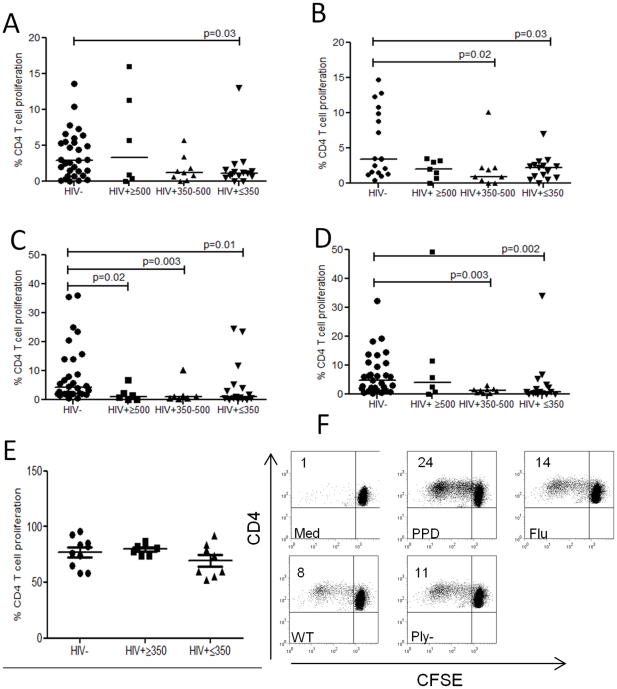
Figure 3. Proliferative capacity of antigen–specific CD4+ T cells.
(a) in response to a wild-type Streptococcus pneumoniae strain (WT), (b)an isogenic pneumolysin (Ply)–deficient mutant (Ply_), (c) M. tuberculosis PPD (d) influenza (e) phytohemagglutinin (PHA) using flow cytometry. Collated data from controls (n = 18–31) and those infected with HIV (≥500 (n = 6−7), 350–500 (n = 7−9), ≤350 (n = 15−16) CD4 T cells/µl blood). Black horizontal bars represent median values of total antigen specific responses above background. Statistical significance was analyzed by the Mann Whitney U test. (f) Representative flow cytometric data demonstrating CD4+ T cell proliferative responses in media only, M. tuberculosis PPD, influenza and pneumococcal antigens. The percentage indicated in the upper-left quadrant represents the cell population that proliferated over the 8-day culture period.

