
Figure 3.
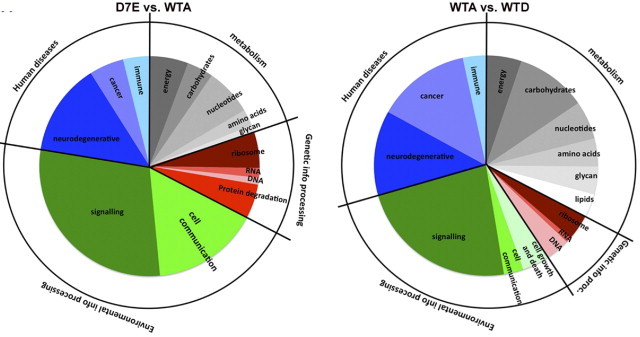
Transcriptome study in D7E and WTA myotubes. Pie chart analysis of KEGG pathways that are deregulated in D7E (left) or WTA (right) myotubes. The inner pie shows the subcategories, and the outer ring shows the major categories.
Official websites use .gov
A
.gov website belongs to an official
government organization in the United States.
Secure .gov websites use HTTPS
A lock (
) or https:// means you've safely
connected to the .gov website. Share sensitive
information only on official, secure websites.
Transcriptome study in D7E and WTA myotubes. Pie chart analysis of KEGG pathways that are deregulated in D7E (left) or WTA (right) myotubes. The inner pie shows the subcategories, and the outer ring shows the major categories.