
Figure 4.
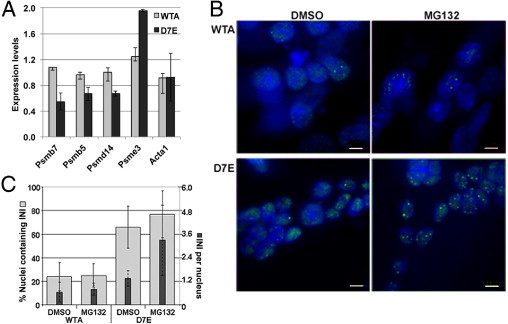
Proteasome down-regulation is associated with protein aggregation in D7E. A: RT-qPCR analysis of proteasome-encoding genes in 4-day myotube cultures of WTA and D7E. Expression levels were calculated from ΔΔCT values after normalization to murine Hrpt and to IM2 parental cells. Error bars are calculated from two biological and six technical replicates. B: The effect of 5 μmol/L MG132 treatment on PABPN1 aggregation. Myotube cultures of WTA and D7E at 4 days after fusion were treated with 5 μmol/L MG132 for 8 hours. Dimethylsulfoxide (DMSO) treatment was used as a control. Protein aggregation and INI formation are detected by immunofluorescence using an anti-FLAG antibody, and nuclei are counterstained with DAPI. Scale bar = 5 μm. C: Histograms show the percentage of nuclei containing PABPN1 INI (gray bars) and the average number of INIs per nucleus (black bars). SDs represent 10 myotubes containing 90 nuclei in total.