
Figure 1.
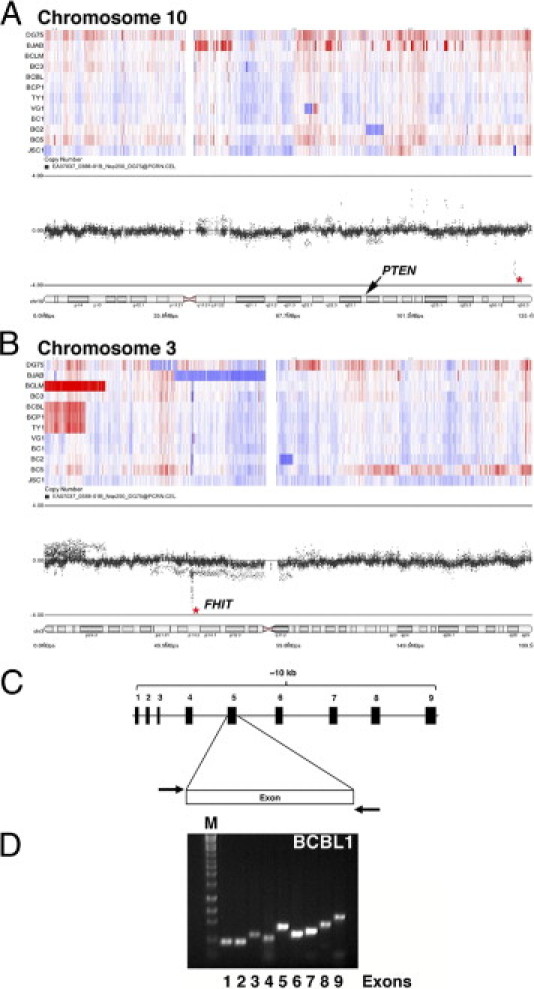
PTEN is wild type in PEL. A and B: Using an Affymetrix 500K single nucleotide polymorphism array, we observed that the majority of PELs do not show genomic gain or loss at the PTEN locus on chromosome 10 (A). Chromosome 3 served as control; distinct loss was noted at the FHIT locus, a known common fragile site gene (B). Heat maps indicate loss (blue) and gain (red). The dot profiles show the distribution of markers along the chromosome; an asterisk marks a small region that is specifically lost in an otherwise normal chromosomal region. On chromosome 10 (A), this does not correspond to any known transcripts; on chromosome 3 (B), it corresponds to FHIT. The labeled cytobands indicate location of PTEN (A) and FHIT (B). C and D: Genomic DNA was isolated from individual PEL cell lines and each of the exons was amplified using specific primers (listed in Table 2). C: Schematic of the organization of the primers used. D: A representative PCR gel showing detection of all nine exons in BCBL-1 cells.