
Figure 3.
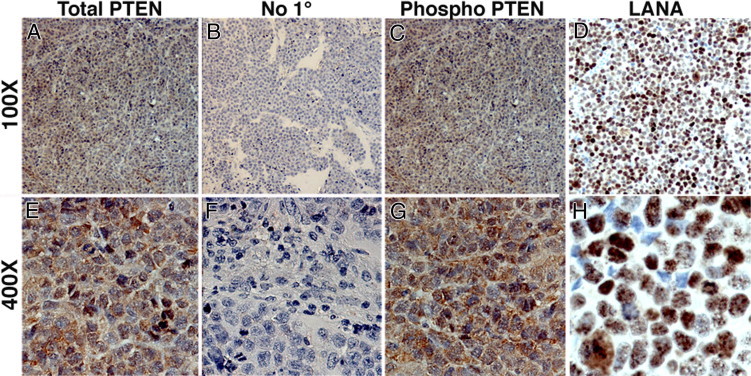
Immunohistochemical analysis of PEL xenograft tumors shows similar localization of total PTEN and phospho-PTEN. BC-1 xenograft tumor sections were stained for total PTEN (A and E), phospho-PTEN (S380) (C and G), and LANA (D and H) (red; NovaRed substrate). Sections were counterstained using hematoxylin (blue), which identifies the nucleus. Sections shown were incubated with dilution buffer either with primary antibody at 1:100 dilution (A, C, D, E and H) or without primary antibody (B and F). No red staining was observed in the no-primary-antibody control (B and D). Original magnification: ×100 (A–D); ×400 (E–H).