
Figure 5.
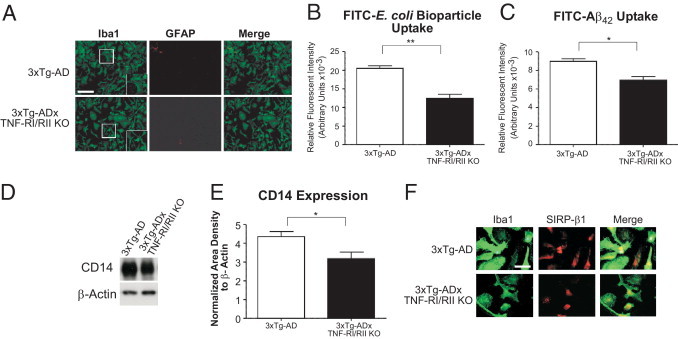
Ablated TNF-α receptor expression reduces general and Aβ42 peptide phagocytosis activity and CD14 surface expression but not SIRP-β1 levels of 3xTg-ADxTNF-RI/RII KO microglia. Primary microglial cultures were established from postnatal day 1 (P1) 3xTg-AD and 3xTg-ADxTNF-RI/RII KO pups and plated onto glass coverslips at a density of 4 × 10⁴ cells/well. A: Cells were stained with Iba1- and GFAP-specific antibodies to detect microglia and astrocytes, respectively. Fluorescent images were taken under ×20 magnification, and merged signals are also shown. Insets: Digitally enhanced images at ×1.5. Error bars represent SEM. Scale bar = 200 μm (A). P1 3xTg-AD and 3xTg-ADxTN-RI/RII KO pups were used to determine the general phagocytic activity of primary microglial cells in the presence of FITC–E. coli bioparticles (B). Cells were plated at 20,000 cells/well in a 96-well culture plate and treated 24 hours later with FITC–E. coli bioparticles or vehicle control for an additional 8 hours. A parallel experiment was performed to assess the uptake of FITC-labeled Aβ42 (C). Extracellular FITC signal was quenched with trypan blue and subsequently the fluorescent intensity was measured. Error bars represent SEM. Statistical analyses were performed using a two-tailed nonparametric Student's t-test. *P < 0.05, **P < 0.001. N = 8. D: CD14 expression detected by Western blot analysis for 3xTg-AD and 3xTg-ADxTNF-RI/RII KO primary microglia. E: Quantification of band intensities and normalization to β-actin. Statistical analyses were performed using a two-tailed nonparametric Student's t-test. *P < 0.05. N = 4. F: SIRP-β1 and Iba1 were concurrently stained using 3xTg-AD and 3xTg-ADxTNF-RI/RII KO microglia. Immunofluorescent images were captured for SIRP-β1– and Iba1-positive cells. Merged images are also depicted. Scale bar = 50 μm (F).