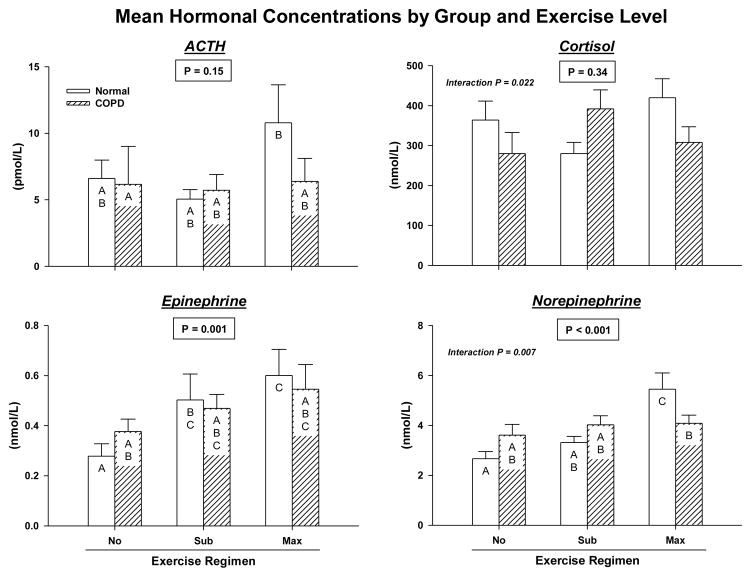
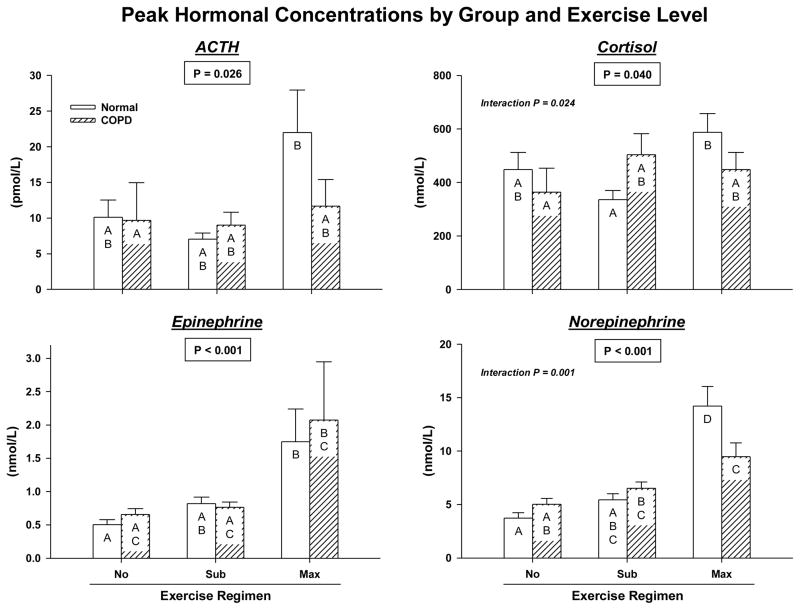
Figure 2.
Mean (Panel A) and peak (Panel B) plasma concentrations of ACTH, cortisol, Epi and NE assessed by two-way ANCOVA. Means with unshared (unique) alphabetic superscripts (such as A vs C, but not A vs AB) are significantly different by Tukey’s honestly significantly different multiple-comparison test (P < 0.05). Open and hatched bars denote control and COPD, respectively.


