
Figure 3.
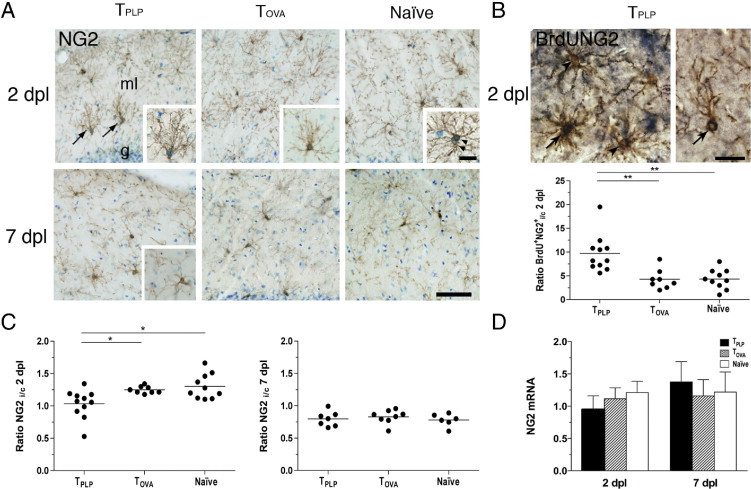
Myelin-reactive T cells stimulate OPC proliferation and differentiation in response to lesioning. A: NG2 staining demonstrates activated NG2+ OPC at 2 days post lesion. Hypertrophic cells (inset in TOVA) and cellular double profiles (inset in Naïve) are observed in all groups of PP-lesioned mice. In TPLP mice, NG2+ cells additionally extended their processes into the area of T cell infiltration (arrows and inset). At 7 days post lesion, the NG2+ cells exhibited a similar structure in all groups, but were difficult to distinguish. Sections were counterstained with toluidine blue for visualization of cellular nuclei. g, granule cell layer; ml, molecular layer. Scale bars: 25 μm; 10 μm (inset). B: BrdU incorporation into mitotic NG2+ cell (left arrow) together with nonmitotic NG2+ cells (left arrowheads) at 2 days post lesion. BrdU incorporation was also observed in NG2+ cells extending their processes into the outer molecular layer (right arrow). Scale bar = 10 μm. Ipsilateral and contralateral ratios of BrdU+NG2+ cells at 2 days post lesion demonstrate a significantly elevated proliferation in TPLP mice compared with TOVA and naïve mice. Lines mark the mean. **P < 0.01. C: NG2+ cells given as ipsilateral and contralateral ratios in the molecular layer in TPLP mice at 2 days post lesion failed to show lesion-induced proliferation. At 7 days post lesion, there was no longer any difference between the groups. D: qPCR analysis of the hippocampus demonstrated a trend toward decreased mRNA expression of NG2 in TPLP mice at 2 days post lesion, whereas no difference was observed at 7 days post lesion. Results are given as mean ± SD.