
Figure 13.
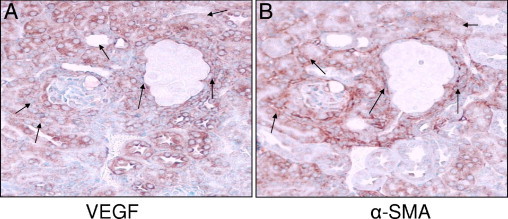
Spatial relationship between renal cell expression of VEGF and α-SMA in Vpr-Agt-4. A and B: Serial sections from Vpr-Agt-4 were immunolabeled for VEGF and α-SMA (protocol C). Representative micrographs showing renal cell labeling for VEGF (A) and α-SMA (B) are shown. Only a limited number of cells displayed labeling for both VEGF and TGF-β (indicated by arrows).