
Figure 9.
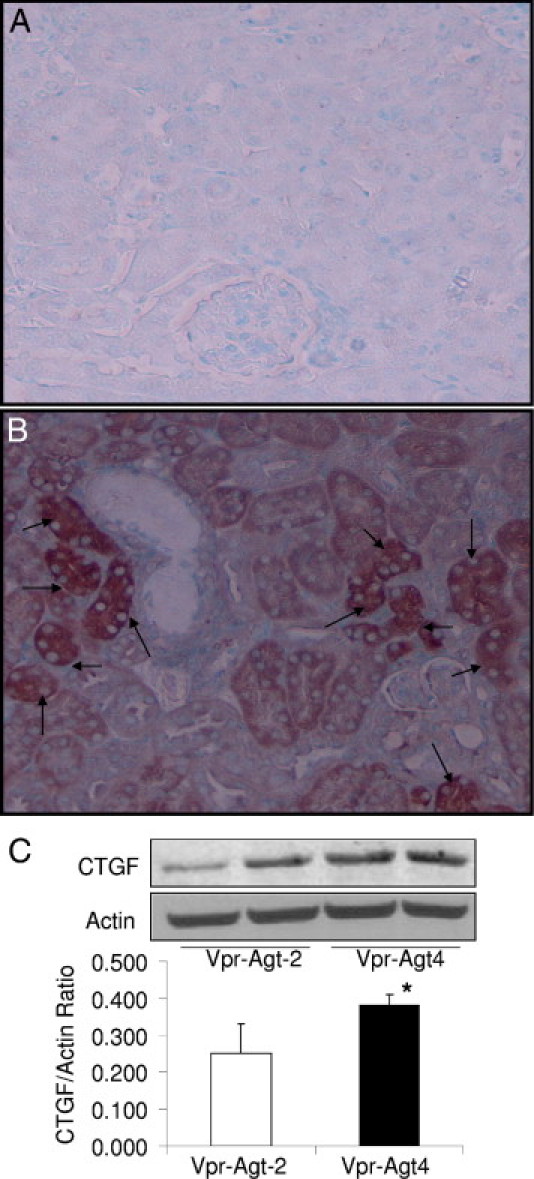
Renal cell expression of CTGF in Vpr-Agt-4 and Vpr-Agt-2 (protocol C). A and B: Renal cortical sections of Vpr-Agt-2 (A) and Vpr-Agt-4 (B) were immunolabeled for CTGF. Tubular cells displayed enhanced expression of CTGF (indicated by arrows) in Vpr-Agt-4. C: Protein was extracted from renal tissues of Vpr-Agt-2 (n = 3) and Vpr-Agt-4 (n = 3); Western blots were prepared and probed for CTGF and actin. Cumulative data in the form of bar diagrams and representative gels are shown. *P < 0.05.