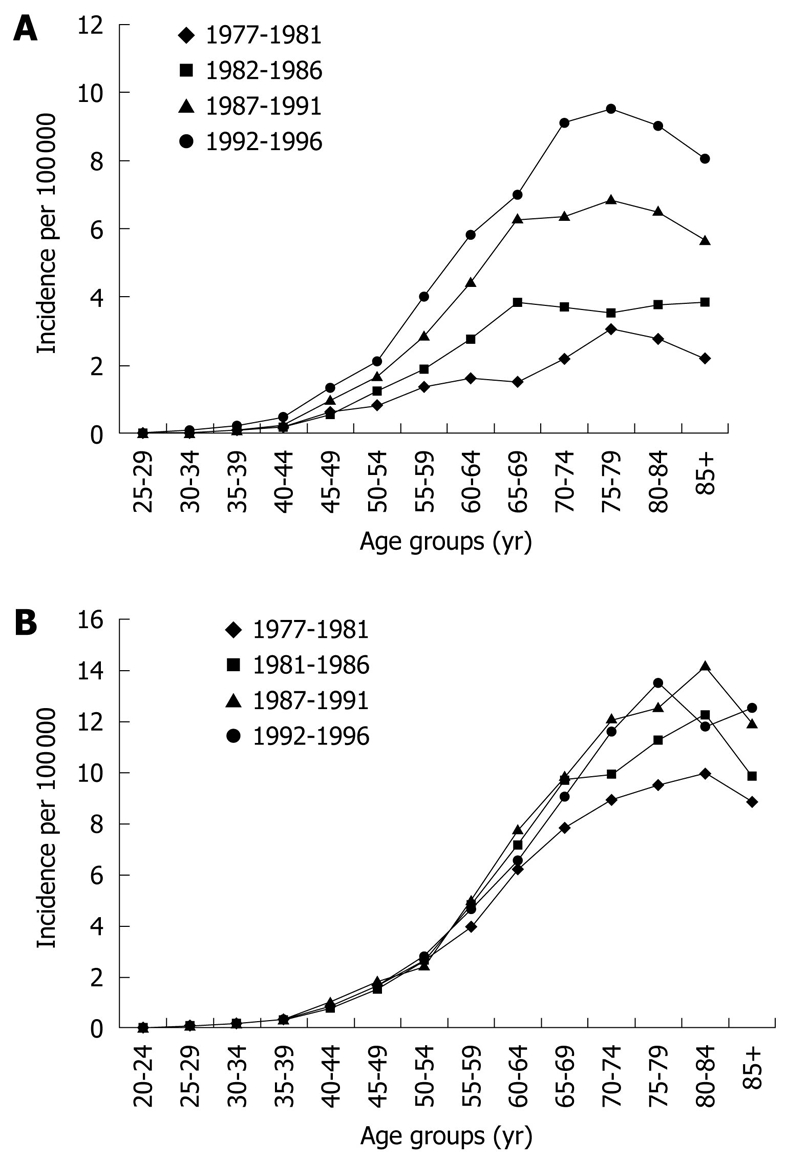
Figure 2.

Age distribution of cases diagnosed with oesophageal adenocarcinoma (A) and gastric cardia adenocarcinoma (B) in the USA between 1977-1996, displaying the "birth cohort effect". Each individual curve represents the age-specific incidence rates in a five year period (from El-Serag et al[70]).
