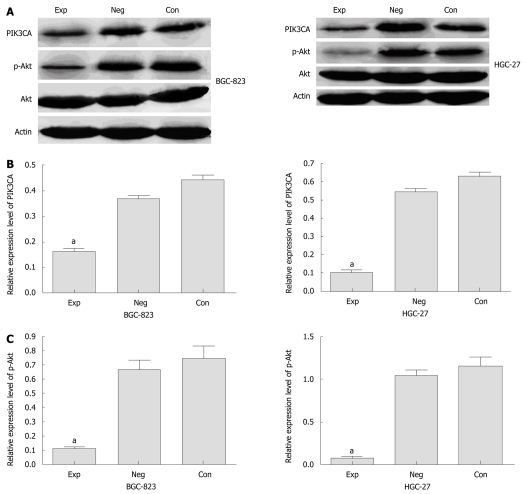
Figure 2.
Protein expression of PIK3CA and p-Akt in gastric cancer cells. A: Expression analyses of PIK3CA and p-Akt protein in cells by Western blotting assay. The representative data are shown in triplicate experiments. β-actin: internal control protein; B and C: Statistical evaluation of relative expression of PIK3CA and p-Akt protein quantified by grey analyses with SigmaPlot 8.0 software. Exp: Experimental group; Neg: Negative control group; Con: Control group. aP < 0.05 vs controls, n = 3.

