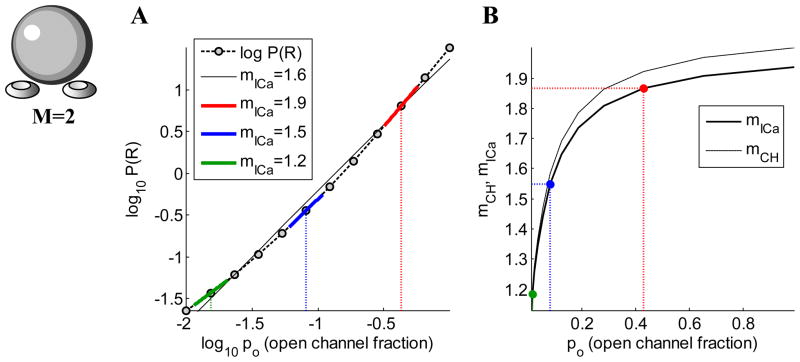
Figure 2.
(A) Log-log plot of release probability vs. open channel probability (computed using Eq. 4), assuming two equidistant channels, and no saturation of release (r=25=32). The value of the slope yields Ca2+ current cooperativity of exocytosis, mICa, and is different along different parts of the curve. The black curve is a regression line, the slope of which would be the experimentally determined mICa. (B) The dependence of both mICa and mCH on po. Colors of points correspond to colors of line segments in (A).

