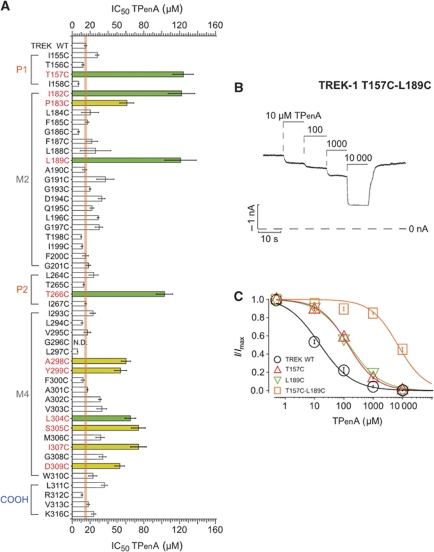
Figure 3.
Identification of residues in the TREK-1 pore that affect TPenA block. (A) IC50 values of TPenA inhibition for TREK-1 WT (n=11) channels and indicated mutations (n⩾4). The orange line represents the deviation (s.e.m.) of the IC50 observed for WT channels. Green bars represent mutations thought to contribute directly to the QA binding site and in yellow those mutations which are not part of the binding site. (B) Current trace from the TREK T157C-L189C double mutation that results in a strongly decreased TPenA affinity. (C) Dose–response relationship from experiments such as in (B) fitted to a standard Hill equation for TREK WT, T157C and L189C mutations and the double mutant which dramatically reduces TPenA affinity; IC50 values of 13±1, 123±11, 120±18 and 8149±428 μM for WT (n=10), T157C (n=5), L189C (n=6) and T157C-L189C (n=4), respectively.

