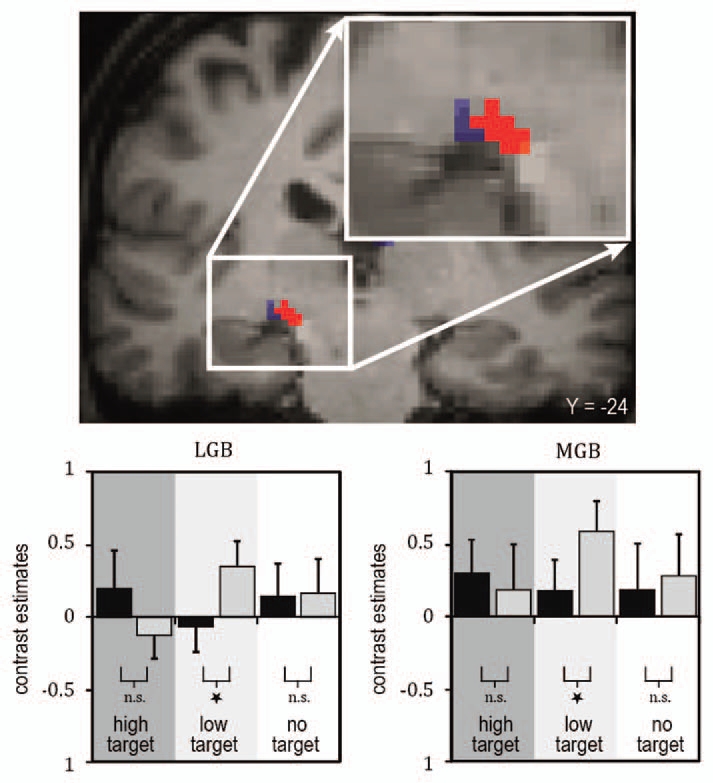
Figure 1.

Illustration of fMRI BOLD (blood oxygen level dependent) responses in subject-specific visual and auditory thalamus (adapted from Noesselt et al.53). Top: Brain section depicts visual (LGB, blue) and auditory (MGB, red) thalamus for one illustrative individual subject (for more details see Noesselt et al.53). The bar graphs below of the brain sections depict the height of the fMRI-signal for the experimental conditions deduced from subject-specific ROIs (region of interest; see bar graphs, with grey bars for sound conditions and black for no-sound for the three visual stimuli: high intensity, low intensity, no visual target). An enhanced fMRI-signal was found when a sound was added to a lower-intensity visual target, but no significant change in response when the same sound was added to a higher-intensity visual target in accord with the behavioral findings.
