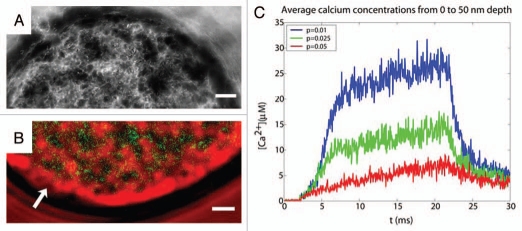
Figure 1.
(A) 3-D reconstruction of the F-actin cortex of a cultured chromaffin cell based in transmitted light images from different planes. The image shows the characteristic network and cages formed by the F-actin cortex. (B) Heterogeneity of intracellular calcium signals during chromaffin cell stimulation. Simultaneous observation of the maximum levels of Fluo-3 signals ([Ca2+]i in green) and transmitted light images of F-actin cytoskeleton (red) showing the spatial coincidence of Fluo-3 signals an empty spaces devoid of cytoskeleton (dark areas). Arrows indicate areas of the F-actin periphery experiencing cortical disruptions. (C) Modeling cytoskeleton cages as diffusion barriers enhances secretory kinetics and sustained calcium levels. Calcium signals for a region between 0 to 50 nm from the membrane surface in a two parallelepiped model. The traces depicted correspond to three increasing porosities of the cytoskeleton: 0.01, 0.025 and 0.05.

