. 2001 Sep;3(3):181–190. doi: 10.31887/DCNS.2001.3.3/llvonmoltke

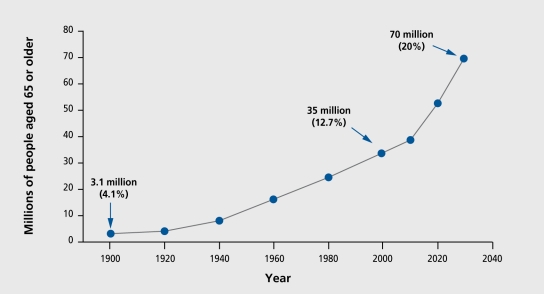
Figure 1. Actual and projected demographic data from the US population' shown as a representative example of cross-national demographic shifts. Ciosed circles connected by solid lines are the actual numbers of individuals aged 65 years or older, with anticipated numbers projected to the year 2030. In parentheses are the numbers expressed as a percentage of the total population. By 2030, it is expected that 70 million Americans will be aged 65 years or older, comprising 20% of the total population. Reproduced from reference 1: Profile of older Americans: 2000. Washington, DC: Administration on Aging. June 2001. www.aoa.dhhs.gov/aoa/stats/profile/. Copyright © 2001, Administration on Aging.

Figure 1.