. 2002 Dec;4(4):377–387. doi: 10.31887/DCNS.2002.4.4/cgilles

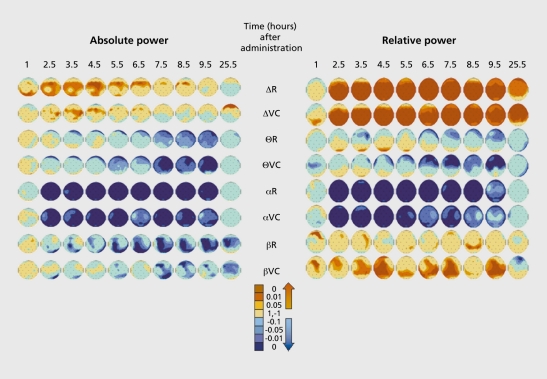
Figure 1. Effect of scopolamine (0.5 mg subcutaneously)on electroencephalogram (EEG) in 12 healthy young men. Placebo and scopolamine were administered according to a crossover, double-blind design. EEG was recorded from 28 electrodes during the first 3 min in vigilance-controlled conditions, and then at rest. Analog filtering 1 to 70 Hz, 12 dB/octave; digitalization with a 256-Hz sampling frequency; fast Fourier transform on each 2-s artifact-free epochs. δ, 0.5-3.5 Hz; Θ, 4-7.5 Hz; α, 8-12.5 Hz; β, 13-32 Hz. Maps displayed are P values after scopolamine-placebo comparison. Scopolamine reduced total power (not shown) and induced an increase in 6 and a decrease in Θ, α, and β absolute power; in relative power analysis, the δ and β bands' activity was increased and that of the Θ and a bands decreased. R, at rest; VC, in vigilance-controlled conditions.


Figure 1.