. 2005 Sep;7(3):207–216. doi: 10.31887/DCNS.2005.7.3/dbertrand

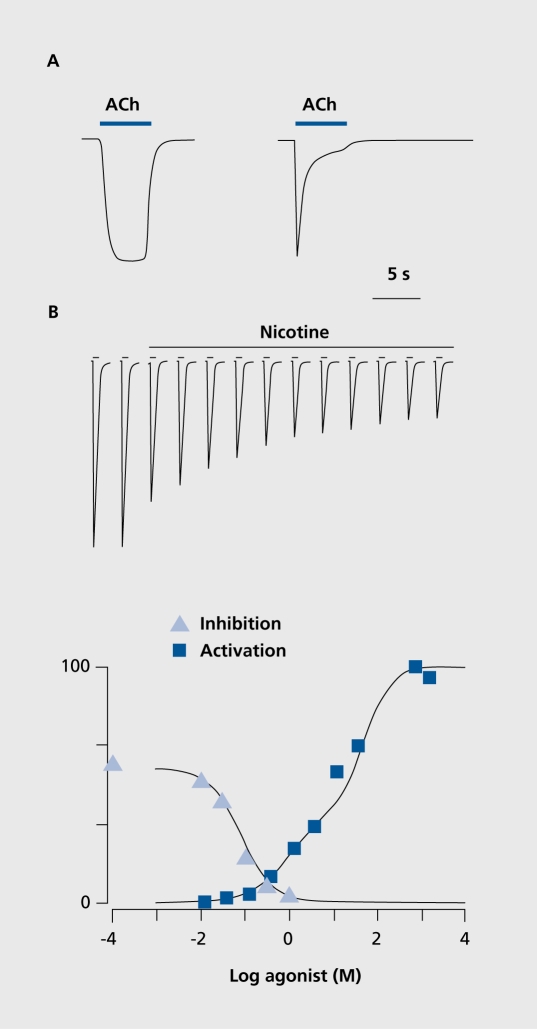
Figure 2. A. Schematic representation of typical acetylcholine (ACh) evoked currents recorded in cells expressing the α4β2 (left trace) or α7 (right trace) receptors. B. Upper panel. Typical protocol used to determine the inhibition caused by a sustained nicotine exposure. The cell is challenged at periodic time intervals with a brief test pulse of agonist at low concentration. Having established that the cell response is stable, a sustained concentration of nicotine concentration comparable to that found in the smoker's brain is applied to the bath. Note the progressive decline of the responses that stabilizes after about half an hour. Lower panel. Plot of the fraction of response as a function of the logarithm of the nicotine concentration yields a typical inhibition dose-response curve that can be compared to the activation profile.

Figure 2.