. 2004 Mar;6(1):5–26. doi: 10.31887/DCNS.2004.6.1/mhoehe

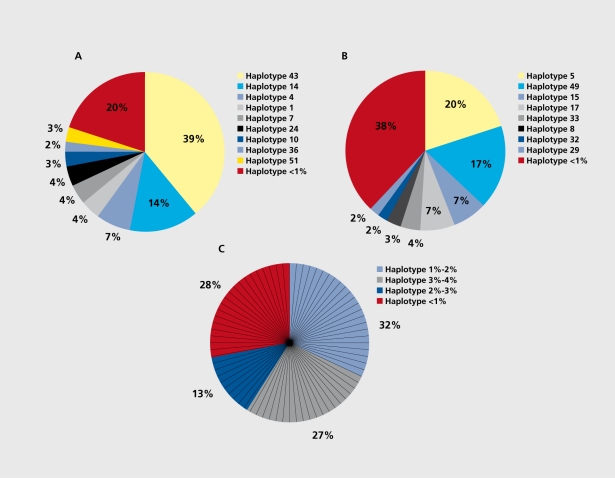
Figure 4. Distribution of haplotype frequencies. Each color-coded segment represents proportionately the frequency (in percent) of one specific haplotype, the corresponding haplotype numbers are given in the box; the red-colored segments contain the fraction of haplotypes with a frequency <1%. A. Haplotype frequencies of the human µ-opioid receptor gene (OPRM1), for corresponding numbers see reference 29. B. Haplotype frequencies of the human β2-adrenergic receptor gene; numbers in the box refer to a table of haplotypes predicted for 237 individuals (data not shown). C. Haplotype frequencies of the bradykinin receptor B2 gene (BDKRB2); numbers in the box refer to a table of haplotypes predicted for 234 individuals (data not shown), in this case, each color-coded major segment does not refer to a specific haplotype, but includes a number of haplotypes within a specific, defined frequency range; this is indicated by the subdivisions into multiple smaller, specific segments, each of which corresponds to one specific haplotype within the segment.

Figure 4