. 2009 Dec;11(4):435–446. doi: 10.31887/DCNS.2009.11.4/afleuchter

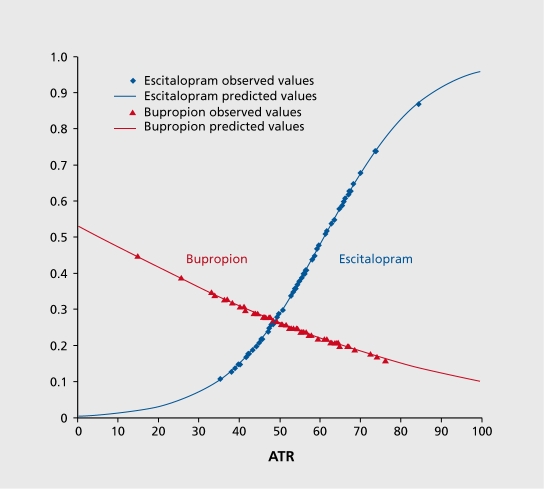
Figure 4. Logistic regression models of escitalopram and bupropion remitters stratified by ATR values. ATR values of subjects randomly assigned to each treatment and who remitted with escitalopram or bupropion treatment. Subjects who remitted with escitalopram (blue) tended to have higher ATR values, and those who remitted with bupropion (red) tended to have lower ATR values. Markers represent observed values and lines represent modeled values. ATR, Antidepressant Treatment Response index Adapted from ref 81: Leuchter AF, Cook IA, Gilmer WS, et al. Effectiveness of a quantitative electroencephalographic biomarker for predicting differential response or remission with escitalopram and bupropion in Major Depressive Disorder. Psychiatry Res. 2009:169:124131. Copyright © Elsevier, 2009 .

Figure 4.