. 2009 Dec;11(4):389–396. doi: 10.31887/DCNS.2009.11.4/mbrammer

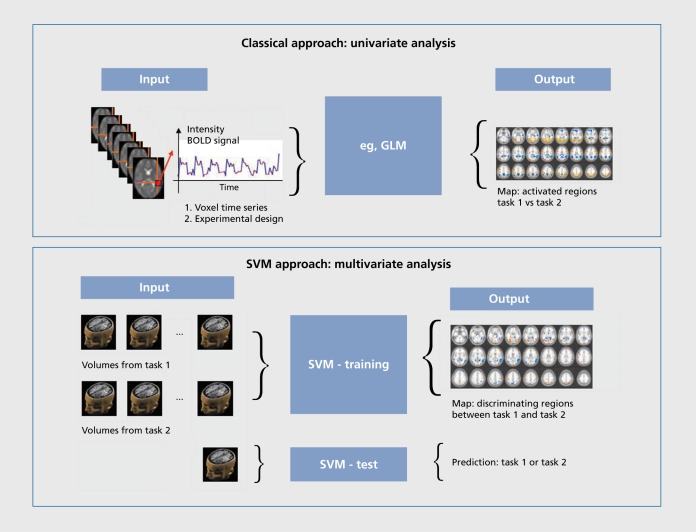
Figure 1. Data flow in a simple 2-task functional magnetic resonance imaging (fMRI) experiment (alternating blocks of each task) through traditional univariate analysis with general linear modeling (GLM) and support vector machine (SVM) analysis. The univariate approach analyses individual voxels using time points when task 1 is being performed and time points where task 2 is being performed, contrasting the two using a simple statistical test (eg, a f test) with a correction for the number of voxels analyzed. The output is a map of regions where the responses to the two tasks are significantly different. SVM-based analysis takes whole-brain volumes when task 1 is being performed and whole-brain volumes when task 2 is being performed and “trains” a computer program to associate patterns of fMRI response with each task. The outputs are a map of the regions which discriminate between the two tasks and a measure of how well the two tasks are discriminated on the basis of the whole brain data. After training, the task being performed can be predicted purely from the fMRI data. For group separation, tasks 1 and 2 can be replaced by groups 1 and 2 ( eg, patients/controls) performing a given task or structural MRI data from the two groups.

Figure 1.