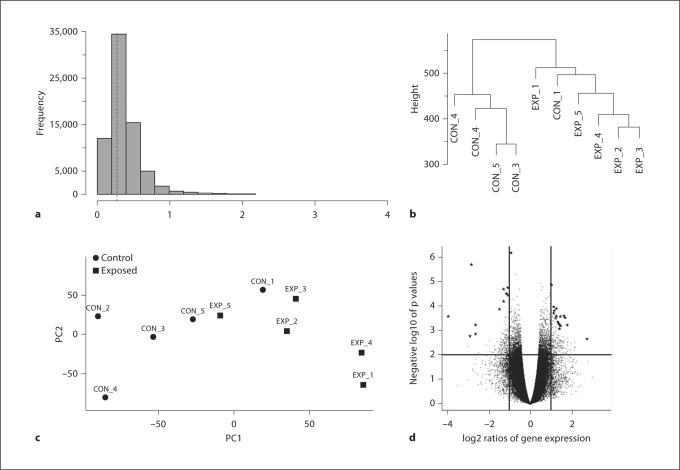
Fig. 1.
Methods used in preprocessing and quality control of the arrays. a Histogram of standard deviations. Genes with very low standard deviations are more likely not to be differentially expressed and were removed from the data. The dotted line represents the peak of the distribution (shorth value). b Hierarchical clustering of the samples (arrays). Control group: CON_1–5; experimental group: EXP_1–EXP_5. c Principal components plots used as dimension reduction of the samples (arrays). d Volcano plot highlighting the top 30 differentially expressed genes (★) between sticklebacks exposed to predator cues and the control group.

