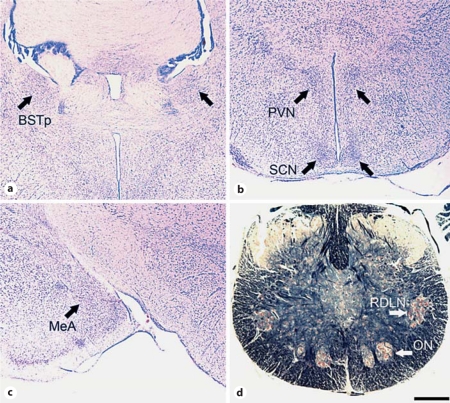
Fig. 1.
Photomicrographs demonstrating the location of nuclei in thionin-stained coronal sections of the Damaraland mole-rat brain (a–c) and a Klüver-Barrera-stained coronal section of the spinal cord (d). Shown are the BSTp (a), PVN and SCN (b), MeA (c), and ON and RDLN (d). Scale bar shown in d = 500 μm (a–c) and 300 μm (d).

