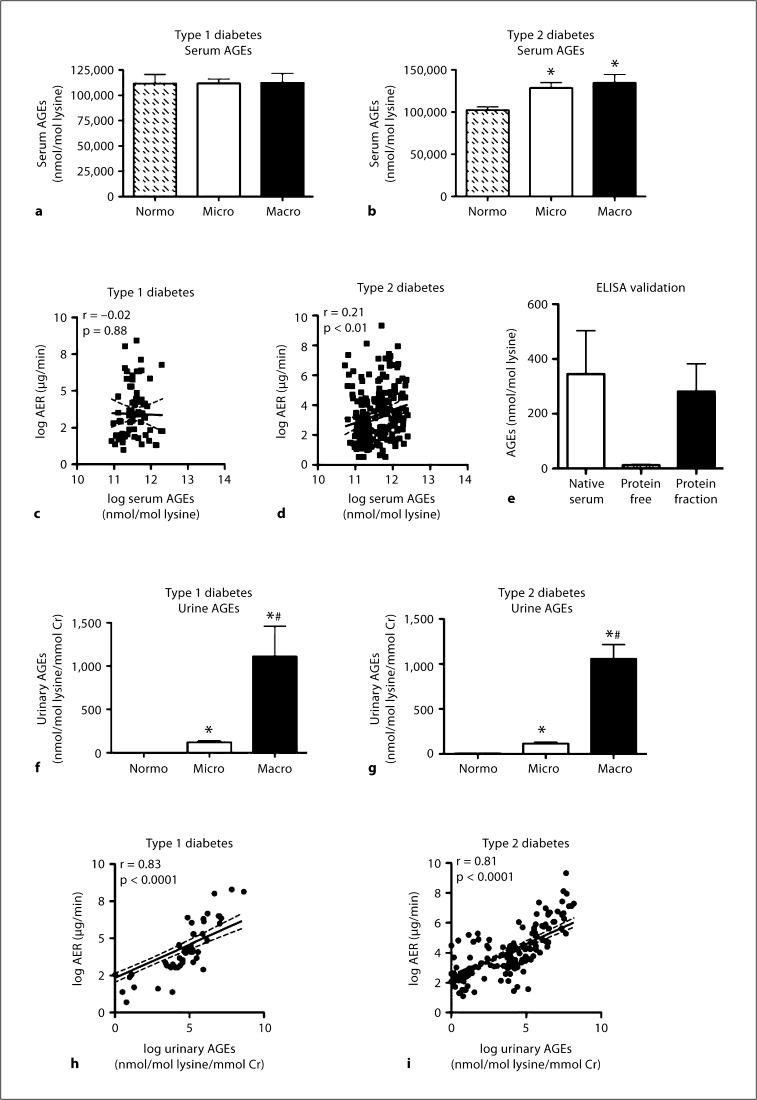
Fig. 1.
Serum AGEs were measured in patients with type 1 diabetes (a) and type 2 diabetes (b), grouped according to renal function. Normo, Micro and Macro describe patients with normoalbuminuria, microalbuminuria and macroalbuminuria, respectively. c Correlation between log-transformed urinary AER (log AER) and log-transformed serum AGEs in patients with type 1 diabetes; r = –0.02, NS, n = 68. d Correlation between urinary log AER and serum log AGE concentration in patients with type 2 diabetes; r = 0.21, p < 0.01, n = 216. e Pooled serum (from 3 patients) was subjected to TCA precipitation and the concentration of AGEs contained within intact (native) serum, the protein-free serum fraction (free AGEs) and the protein fraction (protein-bound AGEs) were tested by in-house ELISA, assayed in triplicate. Urinary excretion of AGEs was measured in patients with type 1 diabetes (f) and type 2 diabetes (g), grouped according to renal function. h Correlation between log AER and urinary log AGE excretion in patients with type 1 diabetes; r = 0.83, p < 0.0001, n = 68. i Correlation between log AER and urinary log AGE excretion in patients with type 2 diabetes; r = 0.81, p < 0.0001, n = 222. Bars represent the mean ± SEM; n = 13–112 patients per group. ∗ p < 0.05 compared to Normo; # p < 0.05 compared to Micro.

