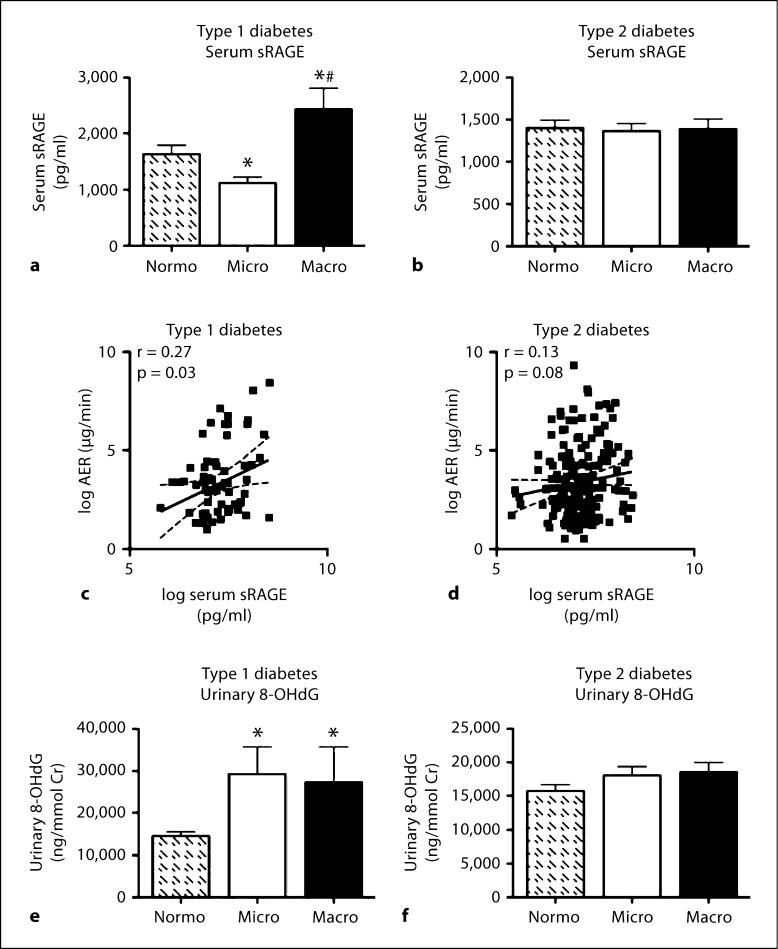
Fig. 3.
Serum soluble RAGE (sRAGE) was measured in patients with type 1 diabetes (a) and type 2 diabetes (b), grouped according to renal function. Bars represent the mean ± SEM; n = 12–62 patients per group. ∗ p < 0.05 compared to Normo; # p < 0.05 compared to Micro. c Correlation between log urinary AER and log serum soluble RAGE concentration in patients with type 1 diabetes; r = 0.27, p < 0.05, n = 68. d Correlation between log urinary AER and log serum soluble RAGE concentration in patients with type 2 diabetes; r = 0.13, p = 0.08, n = 174. Urinary excretion of 8-OHdG was measured in patients with type 1 diabetes (e) or type 2 diabetes (f), grouped according to renal function. Bars represent the mean ± SEM; n = 6–20 patients per group. ∗ p < 0.05 compared to Normo.

