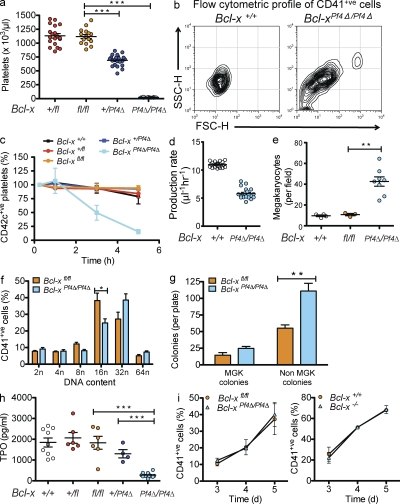
Figure 3.
Bcl-xL is essential for platelet survival. (a) Platelet counts at 7 wk of age in mice with a Pf4-Cre–mediated deletion of Bcl-x. Each symbol represents an individual mouse. Data represent mean ± SEM. n = 15–23 mice per genotype. (b) Representative flow cytometric forward and side scatter profiles of CD41+ve platelets in PRP derived from wild-type and Bcl-xPf4Δ/Pf4Δ mice. (c) In vivo survival of CD42c+ve platelets in Bcl-xPf4Δ/Pf4Δ mice. Platelets were labeled via intravenous injection of a DyLight 488–conjugated anti-GPIbβ (CD42c) antibody. Blood samples were collected 0.25, 1, 3, and 5 h after labeling. Data represent mean ± SEM. n = 8 mice for Bcl-xPf4Δ/Pf4Δ; n = 4 for wild type; n = 3 for Bcl-xfl/fl; n = and 2 for Bcl-x+/fl, Bcl-x+/Pf4Δ. P < 0.0001 at 5 h. (d) Calculated platelet production rates in wild-type and Bcl-xPf4Δ/Pf4Δ mice as described in Materials and methods. P < 0.0001, two-tailed unpaired Student’s t test. (e) Morphologically recognizable MGKs in H&E-stained sections of BM from Bcl-xPf4Δ/Pf4Δ mice. Each symbol represents mean number per field of view (200×) from five fields per mouse. Data represent overall mean ± SEM. (f) Ploidy distribution profile of CD41+ve BMCs. Data represent mean ± SEM. n = 6 mice per genotype. (g) Hematopoietic progenitor cell numbers in adult mice. 25,000 BMCs were cultured with stem cell factor, IL-3, and erythropoietin in semisolid agar for 7 d. Non-MGK colonies represent the total of blast, granulocyte, mixed granulocyte/macrophage, macrophage, and eosinophil colonies. Data represent mean ± SEM. n = 7–11 mice per genotype. **, P = 0.0021. (h) Serum TPO levels. Each symbol represents an individual mouse. Data represent mean ± SEM. ***, P < 0.0001. (i) MGK differentiation from mouse FLC. E12.5 Bcl-x+/+ and Bcl-x−/−, and E13.5 Bcl-xfl/fl, and Bcl-xPf4Δ/Pf4Δ fetal livers were cultured in TPO for 3–5 d and the development of CD41+ve cells measured by flow cytometry. Data represent mean ± SD. n = 3–5 biological replicates (except day 3, n = 2). **, P < 0.005; ***, P < 0.0001.

