Figure 4.
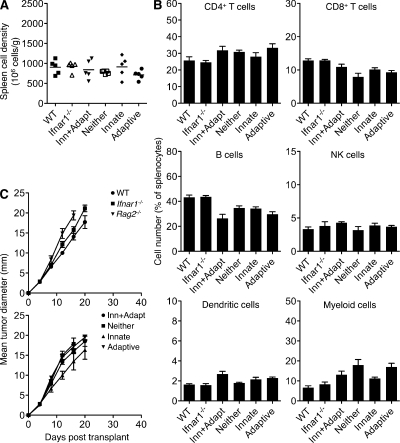
Normal hematopoietic reconstitution in Ifnar1−/− mixed bone marrow chimeras. (A) Spleens were harvested from WT, Ifnar1−/−, or Ifnar1−/− mixed chimeras of each type (12 wk after reconstitution), and cell density was determined. Horizontal bars represent the mean. (B) Percentages of the indicated immune cell subsets were measured by flow cytometry for WT, Ifnar1−/−, and Ifnar1−/− mixed chimeras. Mean values (as a percentage of total splenocytes) ± SEM for four to five mice/group are shown. Cell populations were defined as follows: CD4+ T cells (CD3+CD4+), CD8+ T cells (CD3+CD8+), B cells (B220+), NK cells (DX5+CD3−), DCs (CD11chi), and myeloid cells (CD11b+). (C) WT-derived 1877 tumor cells were injected at a dose of 106 cells/mouse into WT, Ifnar1−/−, Rag2−/−, and Ifnar1−/− mixed chimeras, and tumor growth was monitored over time. Data represent the mean tumor diameter ± SEM for three to eight mice/group. (A–C) Data are representative of two independent experiments.

