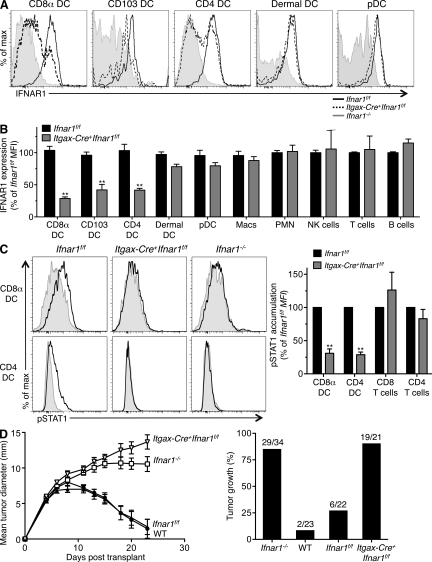
Figure 8.
DCs specifically require type I IFN sensitivity for tumor immunity in vivo. (A) IFNAR1 expression on splenic CD8α+ DCs, CD4+ DCs, pDCs, LN CD103+ DCs, and dermal DCs was measured using flow cytometry in Ifnar1f/f, Itgax-Cre+Ifnar1f/f, and Ifnar1−/− mice. (B) Summary of IFNAR1 levels on the indicated cellular subsets in Itgax-Cre+Ifnar1f/f mice compared with Ifnar1f/f mice (expressed as a percentage of control mean fluorescence intensity [MFI]). Cells were gated as follows: CD8α+ DCs (CD8α+Dec205+CD11chi), CD103 DCs (CD8α−Dec205+CD11chiCD103+), CD4+ DCs (CD8α−Dec205−CD11chiCD4+), dermal DCs (CD8α−CD11chiCD103−), pDCs (B220+PDCA+CD11cint), B cells (B220+), T cells (CD3+), NK cells (NK1.1+), macrophages (CD11b+F4/80+), and blood PMNs (CD11b+Gr1+). IFNAR1 expression was measured using the MAR1-5A3 mAb. Data represent three to five mice from at least three independent experiments. (**, P < 0.01). (C) Splenocytes from Itgax-Cre+Ifnar1f/f mice were untreated (gray) or stimulated for 15 min with 10 ng/ml IFN-αv4 (black), and pSTAT1 accumulation in CD8α+ and CD4+ DCs was measured by flow cytometry. Histograms show a representative experiment, and the bar graph summarizes results from four independent experiments (**, P < 0.01). (B and C) Error bars represent SEM. (D) C57BL/6 WT, Ifnar1−/−, Ifnar1f/f, and Itgax-Cre+Ifnar1f/f mice were injected s.c. with 106 1969 unedited sarcoma cells. Mean tumor diameter ± SEM from a representative experiment is shown, and the bar graph shows a summary of the percentage of tumor-positive mice per group from three independent experiments with indicated groups sizes (P < 0.001 [WT vs. Ifnar1−/−] and P < 0.001 [Ifnar1f/f vs. Itgax-Cre+Ifnar1f/f]) using the Student’s t test at day 23. Comparisons of Ifnar1−/− versus Itgax-Cre+Ifnar1f/f or WT versus Ifnar1f/f were not significantly different.

