Figure 1.
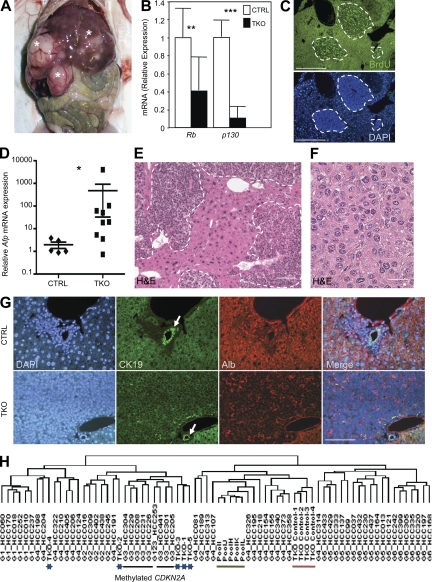
Genetic inactivation of the Rb gene family in the mouse liver results in HCC development. (A) One representative (n > 20) TKO mouse with tumors (asterisks) in the liver is shown 4 mo after intrasplenic Ad-Cre injection. All experiments were performed on TKO mice 3–4 mo after Ad-Cre injection. (B) RT-qPCR analysis of Rb and p130 messenger RNA (mRNA) expression in TKO tumors (n = 9) and control livers (n = 5; CTRL, Rblox/lox;p130lox/lox;p107−/−). (C) Immunostaining on TKO liver sections for the DNA replication marker BrdU. Areas of proliferation are circled with dashed lines. (D) RT-qPCR analysis of Afp mRNA levels in TKO tumors (n = 9) and CTRL livers (n = 5). (E) H&E staining of TKO liver sections with multiple independent tumors (delineated by dashed lines). (F) At higher magnification, tumor cells resemble small hepatocytes. (G) Representative sections (n > 20) from CTRL and TKO livers were stained with DAPI, CK19, and Albumin (Alb). The white arrows point to a bile duct. Merged pictures are shown on the right. (H) Nonsupervised hierarchical clustering of gene expression profiles from human HCCs and mouse TKO tumors (blue asterisks). The black bar marks human tumors in the group G3, which are characterized in part by methylation of the CDKN2A locus. The green bar marks normal human liver samples, and the red bar marks CTRL mouse livers. Error bars indicate SEM. *, P < 0.05; **, P < 0.01; ***, P < 0.001. Bars: (C, E, and G) 50 µm; (F) 5 µm.

