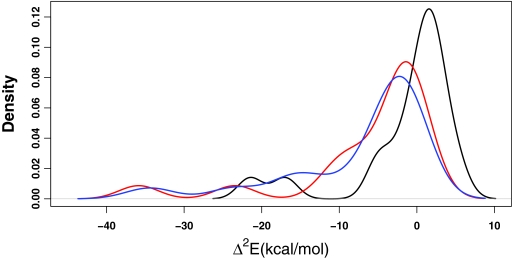
Figure 4.
The distribution of the two-body corrections to the ligand-binding pocket interaction energies at the HF level (black), M06-L level (red), and PM6-DH2 level (blue). The y axis denotes the density for all three plots (the AUC = 1). Most pairwise interactions fall into a range of [−5.06:2.70] kcal/mol for HF, [−11.10:−0.31] kcal/mol for M06-L, and [−16.00:−1.08] kcal/mol for PM6-DH2 level.

