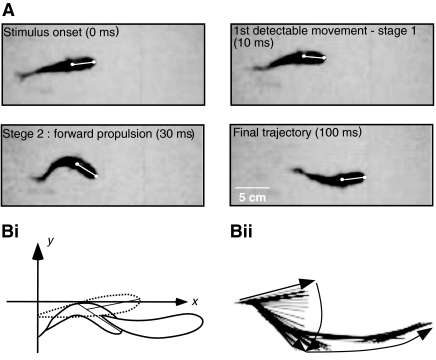
Fig. 2.
Stages of the C-start escape and measurements of escape kinematics (A) Video picture showing selected frames of the stages of a goldfish escape behavior filmed from below at 1000 frames per second. Heavy lines represent anterior midline from head to center of mass (COM). (Bi) The x- and y-positions of the head and COM were measured and the vector connecting these two points was used to measure the angle of orientation, taking the position at the first frame as the reference point. (Bii) Computer-generated plot of the trajectory in A at 2 ms intervals.

