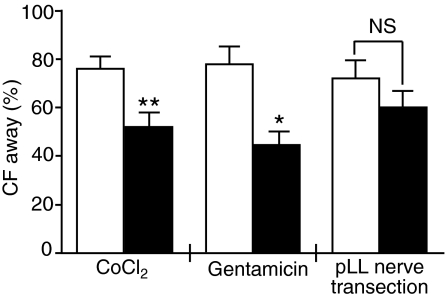
Fig. 5.
Comparison of frequency of correct (aversive) escape responses in the center field (CF) following complete lateral line (LL) elimination with 0.03 mmol l–1 CoCl2 or 0.002% gentamicin, or partial LL elimination through pLLn transection. Column graphs represent mean frequency of correct responses ± s.e.m. for each group pre- and post-treatment. Asterisks represent statistically significant pre- and post-treatment differences in response (Wilcoxon signed-rank test, *P<0.05, **P<0.01). NS, not significant.

