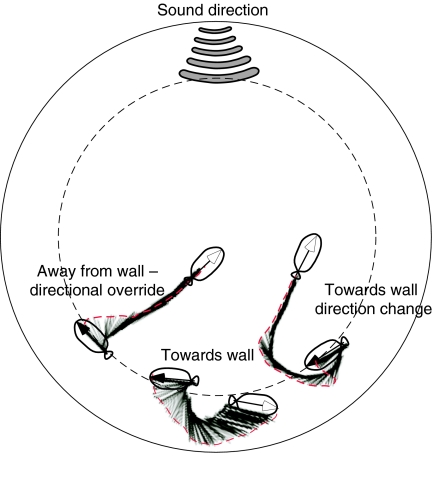
Fig. 6.
Computer-generated silhouettes of various escape trajectories when the fish is near the wall. Lines represent x- and y-coordinates at 2 ms intervals. Filled arrows represent the starting position of the fish and open arrows represent the final position of the fish at the end of the C-start. The dashed black line depicts the area where the fish are within two-thirds of their body length away from the wall (solid line). This marks the near wall area in the behavior tank. The trajectories are depicted by the dashed red lines.

